
 LMS
LMS
 Reels Series
Why Data Analytics Is a Good Career Choice for Freshers in India
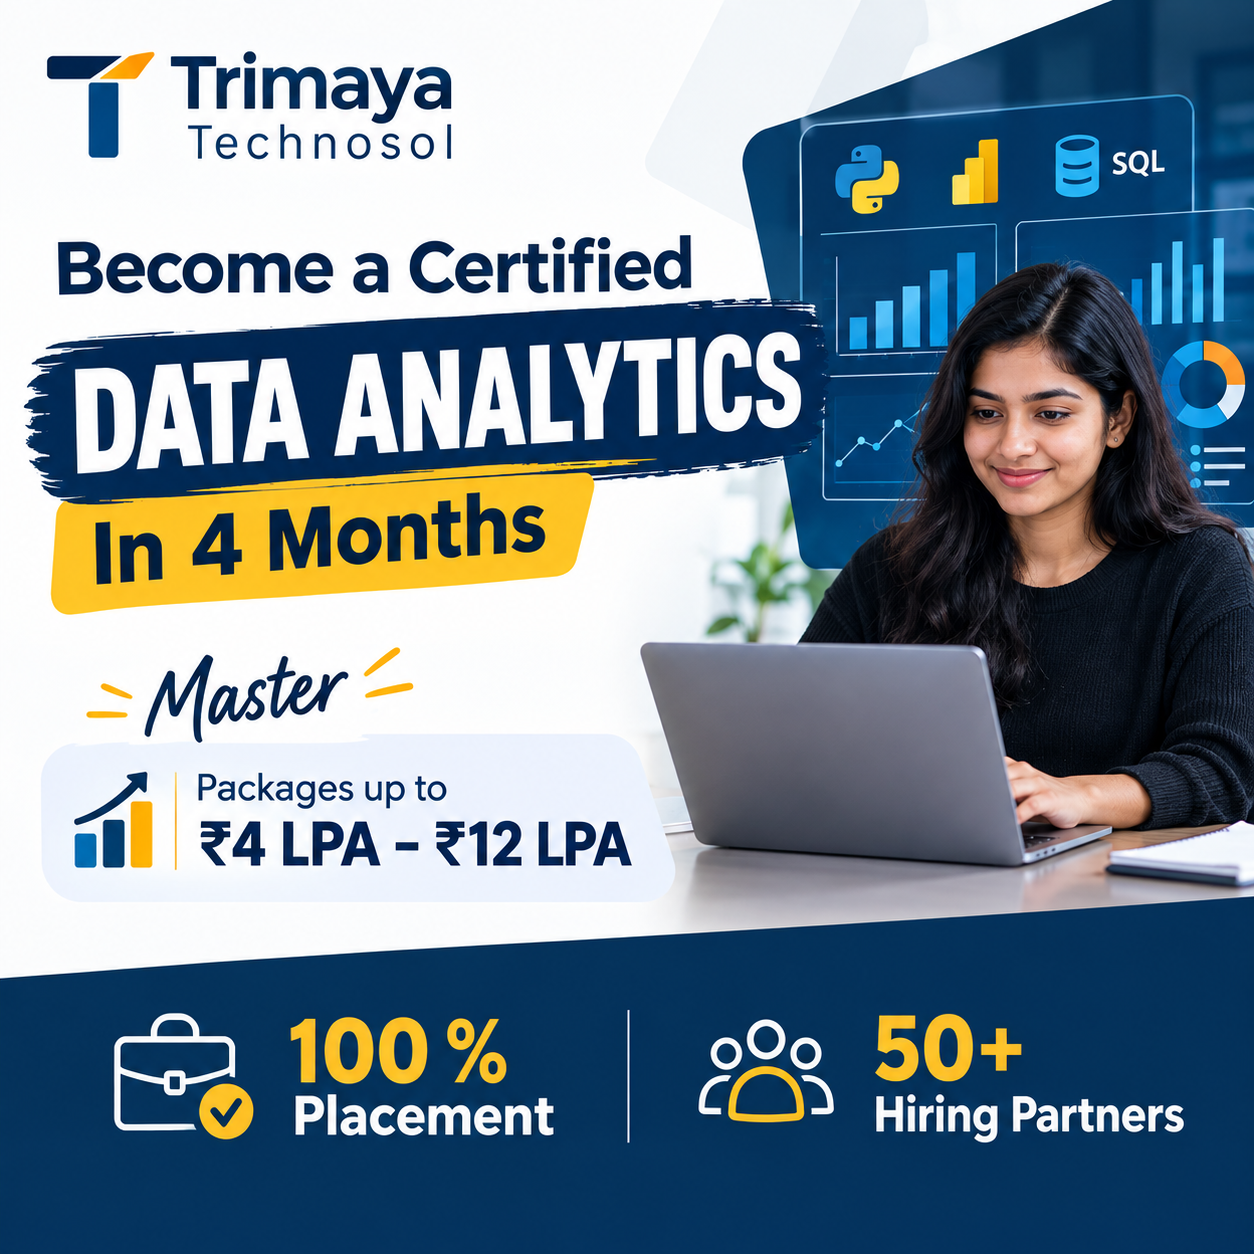
Choosing the right career after graduation can be challenging for many students in India. With technology transforming businesses across industries, employers increasingly rely on data to understand customers, improve operations, and make informed decisions. This has made data analytics an attractive career option for freshers who want to develop technical skills and explore opportunities in the IT and business sectors.
Data analytics involves collecting, organizing, examining, and interpreting information to identify patterns and generate useful insights. From banking and healthcare to retail, e-commerce, and information technology, organizations use analytics to solve problems and improve business performance.
For students and recent graduates, this field offers an opportunity to combine analytical thinking, technology, and business knowledge. The best part is that beginners can start learning essential analytics tools without necessarily having an advanced programming background.
In this article, we will explore why data analytics is a promising career path for freshers in India, the skills required, the tools to learn, and the steps to prepare for entry-level opportunities.
1. Growing Importance of Data Across Industries
Businesses generate large amounts of data through customer transactions, websites, mobile applications, sales systems, and internal operations. However, collecting information is only the first step. Organizations also need professionals who can interpret this data and turn it into meaningful insights.
Data analysts help businesses answer important questions, such as:
-
Which products generate the most revenue?
-
Why are sales increasing or decreasing?
-
What factors influence customer behavior?
-
Which marketing campaigns perform best?
-
How can operational costs be reduced?
-
What trends should the business investigate?
These questions demonstrate how analytics supports decision-making across different industries.
For freshers, learning how to answer business questions using data can provide a foundation for exploring several career paths.
2. Multiple Career Opportunities for Freshers
One reason data analytics attracts beginners is that analytical skills are useful across a range of business functions.
Depending on their skills, qualifications, and experience, freshers may explore roles such as:
Junior Data Analyst: Works with datasets, prepares reports, identifies trends, and supports analytical tasks.
Reporting Analyst: Creates regular reports, tracks key performance indicators, and summarizes business results.
Business Intelligence Analyst: Uses reporting and visualization tools to help organizations monitor performance and understand business trends.
Operations Analyst: Examines operational data to identify inefficiencies and opportunities for improvement.
Marketing Analyst: Studies campaign results, customer behavior, and engagement metrics to support marketing decisions.
MIS Executive or Analyst: Works with business reports, spreadsheets, and management information systems.
The responsibilities and requirements of these roles vary by employer. Freshers should review job descriptions carefully to understand the tools, qualifications, and practical skills required.
3. You Can Start Learning Without Advanced Coding Knowledge
Many beginners assume that entering a technical field requires extensive programming experience. While coding is valuable for several analytics roles, you can begin learning the fundamentals without mastering advanced programming.
A practical learning path may start with Microsoft Excel, followed by SQL, data visualization, and Python.
Excel helps beginners organize data, perform calculations, and create reports. SQL allows them to retrieve and summarize information from databases. Visualization tools help present findings through charts and dashboards, while Python can support more advanced analysis and automation.
By learning these skills progressively, freshers can build confidence and gradually tackle more complex analytical problems.
4. Important Tools Every Aspiring Data Analyst Should Learn
Developing practical knowledge of commonly used analytics tools is an important step toward preparing for entry-level roles.
Microsoft Excel
Excel is useful for data cleaning, calculations, reporting, and basic analysis. Beginners should learn formulas, lookup functions, pivot tables, charts, and data validation.
SQL
SQL is used to access and analyze information stored in relational databases. Important topics include SELECT statements, filtering, grouping, aggregate functions, joins, and subqueries.
Python
Python supports data manipulation, exploratory analysis, and automation. Beginners can start with basic programming concepts before progressing to libraries such as Pandas and NumPy.
Power BI or Tableau
These tools help analysts create interactive dashboards, visualize trends, and communicate findings. Learners should practice connecting data sources, building charts, creating filters, and presenting key performance indicators.
Basic Statistics
An understanding of averages, percentages, distributions, correlation, and variability helps analysts interpret results accurately.
Freshers do not need to master every tool simultaneously. Starting with foundational skills and applying them through regular practice is a more manageable approach.
5. Practical Projects Help You Stand Out
Learning the theory behind data analytics is important, but practical experience helps demonstrate what you can actually do with the tools.
Personal projects are especially useful for freshers who have limited professional experience. They provide examples of problem-solving, analytical thinking, and communication skills.
Here are some projects beginners can explore.
Sales Data Analysis
Analyze a sample sales dataset to identify revenue trends, top-selling products, and regional performance.
Tools: Excel, SQL, or Power BI.
Customer Behavior Analysis
Study purchasing patterns to understand customer activity, order frequency, and product preferences.
Tools: SQL, Python, or Excel.
Employee Attrition Analysis
Explore a sample employee dataset to examine workforce trends and investigate patterns associated with employee turnover.
Tools: Python, Excel, or Power BI.
E-Commerce Dashboard
Create an interactive dashboard displaying revenue, order volume, product categories, and monthly performance.
Tools: Power BI or Tableau.
Financial Performance Analysis
Compare revenue, expenses, and profit margins to understand financial trends.
Tools: Excel or Power BI.
For each project, explain the problem, dataset, methods used, key findings, and recommendations. Documenting your work clearly makes it easier to discuss your skills during interviews.
Always use public, sample, or appropriately anonymized data for portfolio projects.
6. Build a Portfolio Before Applying for Jobs
A portfolio allows recruiters to evaluate your practical abilities beyond your academic qualifications.
As a fresher, you can begin with two or three well-documented projects and improve your portfolio over time.
Your portfolio should include:
-
A clear project objective.
-
A description of the dataset.
-
Tools and techniques used.
-
Data cleaning and analysis steps.
-
Charts, reports, or dashboards.
-
Key findings and conclusions.
-
Recommendations based on the analysis.
You can use GitHub for code and documentation or share dashboards and project summaries through appropriate platforms.
A strong portfolio does not need to contain dozens of projects. A few meaningful examples that you can explain confidently may be more useful than a large collection of incomplete work.
7. Data Analytics Offers Opportunities Across Different Industries
Data analytics is not limited to technology companies. Many industries use analytical methods to understand performance, identify trends, and improve decision-making.
Banking and finance: Analysts can support transaction reporting, customer analysis, and financial performance monitoring.
Healthcare: Data analysis can help examine operational performance, resource utilization, and service trends.
Retail and e-commerce: Businesses analyze sales, inventory, purchasing patterns, and customer engagement.
Manufacturing: Organizations use data to monitor production, quality, and operational efficiency.
Education: Institutions can study enrollment, attendance, and student performance trends.
Marketing: Teams analyze campaign results, audience engagement, and conversion metrics.
This variety allows freshers to explore industries that align with their interests and educational backgrounds.
8. How Freshers Can Improve Their Job Readiness
Learning analytics tools is only one part of preparing for employment. Freshers should also develop communication skills, business understanding, and interview confidence.
Consider the following steps:
Create a focused resume: Highlight your technical skills, relevant academic work, projects, and certifications you have actually earned.
Practice technical questions: Work on Excel formulas, SQL queries, basic statistics, and visualization concepts.
Explain your projects: Be ready to describe the problem, your approach, the tools you used, and what you learned.
Improve communication: Practice explaining charts, trends, and recommendations in simple language.
Study job descriptions: Identify frequently requested skills and prioritize learning those that match your target roles.
Apply consistently: Explore internships, trainee positions, junior roles, and other suitable opportunities.
There is no single guaranteed route into the field. However, structured preparation and practical experience can help you present your abilities more effectively.
9. Is Data Analytics a Good Career Choice for Non-IT Graduates?
Data analytics can also be worth exploring for graduates from commerce, management, economics, mathematics, science, and other disciplines.
Different educational backgrounds can offer useful perspectives. For example, commerce graduates may already understand financial statements, while management students may be familiar with business performance and marketing concepts.
Non-IT graduates may need additional time to develop technical skills, particularly SQL and Python, depending on their target roles. They can start with spreadsheet analysis and statistics before progressing to other tools.
The important factors are a willingness to learn, regular practice, logical thinking, and the ability to apply analytical methods to real problems.
Before committing to a learning path, review the requirements of the positions you want to pursue.
10. How to Choose the Right Data Analytics Training Program
A structured training program can help freshers learn concepts in sequence, receive guidance, and practice using analytics tools.
Before enrolling, compare programs based on the following factors:
-
Course syllabus: Check which tools and foundational concepts are included.
-
Practical exercises: Look for assignments, datasets, and project-based learning.
-
Trainer support: Understand how doubts and technical questions are addressed.
-
Learning format: Choose a schedule and delivery method that suit your needs.
-
Portfolio development: Check whether you will complete projects that demonstrate your skills.
-
Career support: Ask whether resume guidance, interview preparation, or placement assistance is available.
-
Transparency: Review the fees, duration, certification details, and course requirements.
If you are exploring a data analytics course in pune, compare the syllabus and practical learning opportunities with your career goals before making a decision.
You can also explore the Data Analytics Course offered by Trimaya TechnoSol to review the available program information and determine whether it matches your learning requirements.
11. A Simple Learning Roadmap for Freshers
Beginners can organize their learning into manageable stages instead of trying to study every tool at once.
Stage 1: Learn the Fundamentals
Understand the purpose of data analytics, basic statistics, spreadsheets, and how businesses use data.
Stage 2: Develop Technical Skills
Practice Excel and SQL, then introduce Python and a visualization tool based on your goals.
Stage 3: Work on Projects
Analyze sample datasets, clean data, create dashboards, and document your findings.
Stage 4: Build a Portfolio
Organize your projects and explain your process, results, and recommendations clearly.
Stage 5: Prepare for Interviews
Practice technical questions, revise important concepts, and learn to discuss your projects confidently.
The time required for each stage depends on your existing knowledge, study schedule, and learning goals. Consistency and hands-on practice are essential throughout the process.
Conclusion
Data analytics can be a promising career direction for freshers in India who enjoy working with information, solving problems, and learning technology. Its applications across industries create opportunities to explore different roles, from reporting and business intelligence to marketing and operations analysis.
To get started, focus on analytical fundamentals, Excel, SQL, statistics, and data visualization. Gradually expand your skills with Python and other relevant tools. Build practical projects, create a portfolio, and prepare for interviews to demonstrate your abilities.
Remember that completing a course alone does not guarantee employment. Your practical skills, project experience, communication, and preparation all contribute to your career development.
If you are ready to begin learning, explore the Trimaya TechnoSol Data Analytics Course and review the available training details to decide whether the program fits your goals.
Frequently Asked Questions
1. Is data analytics suitable for freshers in India?
Yes. Freshers can explore entry-level analytics and reporting roles by developing relevant technical skills, completing projects, and preparing for interviews. Requirements vary across employers.
2. Which skills should a fresher learn first?
Excel, SQL, basic statistics, and data visualization are useful starting points. Python can help expand your analytical capabilities as you progress.
3. Can a non-IT student become a data analyst?
Yes. Students from different educational backgrounds can learn data analytics. The technical requirements depend on the role, so beginners should build their skills progressively.
4. Are projects important for getting a data analytics job?
Projects help demonstrate how you work with datasets, use analytical tools, and communicate findings. They can be especially valuable for candidates without professional experience.
5. Does learning data analytics guarantee a job?
No. Training can help develop relevant skills, but employment depends on several factors, including proficiency, qualifications, project experience, interview performance, and market conditions.
6. Where can I learn more about data analytics training?
Visit the Trimaya TechnoSol Data Analytics Course page to review the available course information and determine whether it suits your learning objectives.
 English
 Arabic
 French
 Spanish
 Portuguese
 Deutsch
 Turkish
 Dutch
Dutch
 Italiano
 Russian
 Romaian
 Portuguese (Brazil)
 Greek
Greek